#112 What Story Is Your Data Telling You?
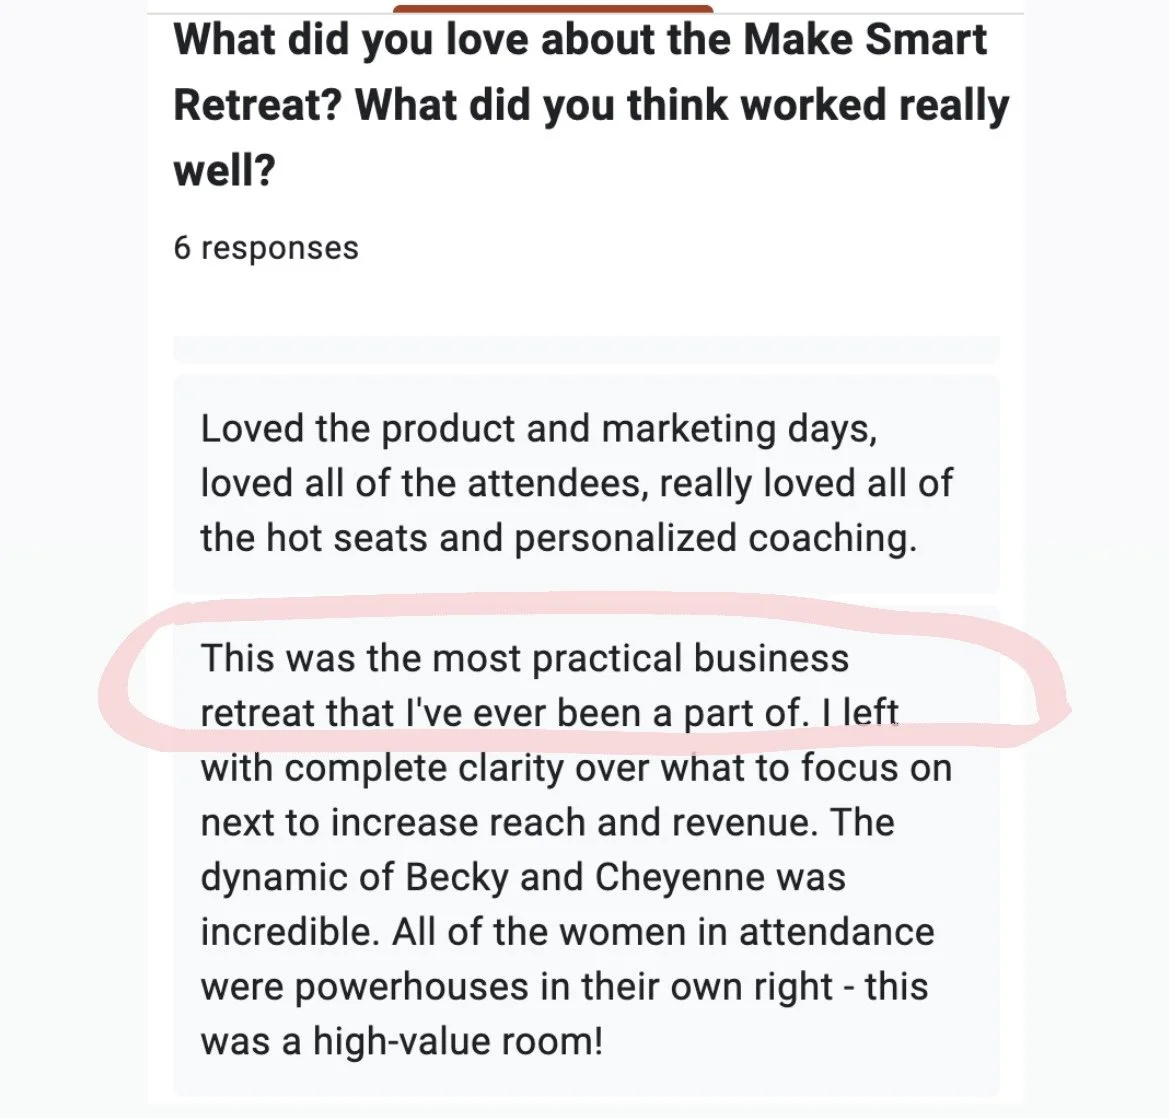
We're home from our trip to Nashville for the Make Smart retreat and honestly ... the retreat went as well as it possibly could have.
Going into it this week we weren't sure if we'd do it all again, but we've decided – we're definitely hosting Make Smart again. It was so much fun and the feedback has been better than we could have imagined.
If you want to join next time, vote in the poll below this week's essay.
At the Make Smart Retreat, we packed over 200 slides into three days of workshops. But I promise, it wasn’t death by PowerPoint Canva Slides.
Most of those slides were step-by-step prompts with exercises we walked through in real time.
Here’s a behind-the-scenes look at what we covered on Data Day, and how you can apply it inside your own business.
Let’s get into it –
On Day 1, we kicked things off with one of the most powerful levers for improving your community, product, and marketing: your data.
But not just spreadsheets and dashboards. We talked about how to tell a story with your data.
The Two Types of Data You Actually Need
There are two kinds of data that help you make better decisions:
Qualitative data tells you why. It comes from conversations in your DMs, client calls, testimonials, and member forums.
Quantitative data tells you what. Think conversion rates, signups, drop-offs, and analytics.
The real magic happens when you bring the two together:

my favorite venn diagram
Here's an example:
You might notice that 50 percent of people stop engaging after onboarding. That’s quantitative. If your member interviews also show confusion about how to navigate the first module, that’s qualitative. Together, they tell a clear story and give you a path to fix it.
Start Here: Challenge Your Assumptions
One of the prompts we gave retreat attendees was this:
“What do you believe to be true about your customers, but don’t actually have the data to back up?”
This question helps surface your blind spots. We all make assumptions. But if you’re struggling to sell your offer, retain members, or create momentum, your assumptions might be getting in the way.
When I worked in product strategy for Fortune 500 companies, I watched businesses waste hundreds of thousands of dollars building the wrong thing. Don’t let that happen in your community.
Try this instead: Write down the assumptions you’re making. Then, figure out where you could collect real data to validate or replace them.
What Counts as Good Data?
Here are a few places to collect data without overcomplicating it:
Qualitative sources
Instagram DMs and replies
Discovery calls or coaching sessions
Community forums or Slack groups
Referrals and word-of-mouth—how do people describe you to others?
Testimonials or reviews
Quantitative sources
Website traffic and page analytics
Course or membership usage data (Where do people drop off?)
Conversion rates on lead magnets, webinars, or sales pages
Surveys with multiple-choice or rating scale questions
A/B tests across different formats or funnels
For both types, I love screenshotting interesting moments and dumping them into a Miro board. Later, I go back and look for patterns. It’s scrappy but effective.
Data Prompts Across Your Funnel
Cheyenne guided attendees through specific data prompts across four key stages of their funnel. Here’s a quick look at what you can audit:
1. Top of Funnel
Goal: Grow your audience
What channels are bringing in traffic and leads?
Where is your content performing best in terms of reach or engagement?
When you look at recent customers, where did they find you?
2. Lead Generator
Goal: Collect email addresses
Which lead generators are getting the most downloads?
Which ones are bringing in actual buyers?
What is the conversion rate on your opt-in page? (Ideal is 50% to 70%)
3. Conversion Event
Goal: Move people closer to purchase
How many people register?
How many show up live?
What percentage go on to book a call or make a purchase?
4. Sales Period
Goal: Close the sale
What is your sales page conversion rate?
What’s the conversion rate on your checkout page?
Are you using follow-up tools like abandoned cart emails or personal outreach?
Your Turn: Action Steps
If you want to use data to make smarter, faster decisions, start here:
✅ Write down 3 assumptions you’re making about your audience
✅ Pull as much qualitative data (like a DM or testimonial) and quantitative data (like a drop-off rate or sales page stat) that you have to solve for your assumptions
✅ Review your funnel using the prompts above and spot one gap
✅ Ask: What story is my data telling me?
You don’t need to overhaul everything overnight. But if you take 30 minutes this week to audit your assumptions and collect a few key data points, you’ll uncover real opportunities to improve your community, product, or offer.
And if you’re planning to join us at a future Make Smart Retreat, the more data you have ahead of time, the more powerful our time together will be.
Let me know what insights come up for you – I’d love to hear what your data is saying!
If you loved this, you can subscribe to the weekly newsletter here for free! I send a bunch of resources & share a bts happenings of my business in the email version.
If you want help with your data collection & research analysis, you can work with my agency Affinity Collective.